DATA VISUALIZATION
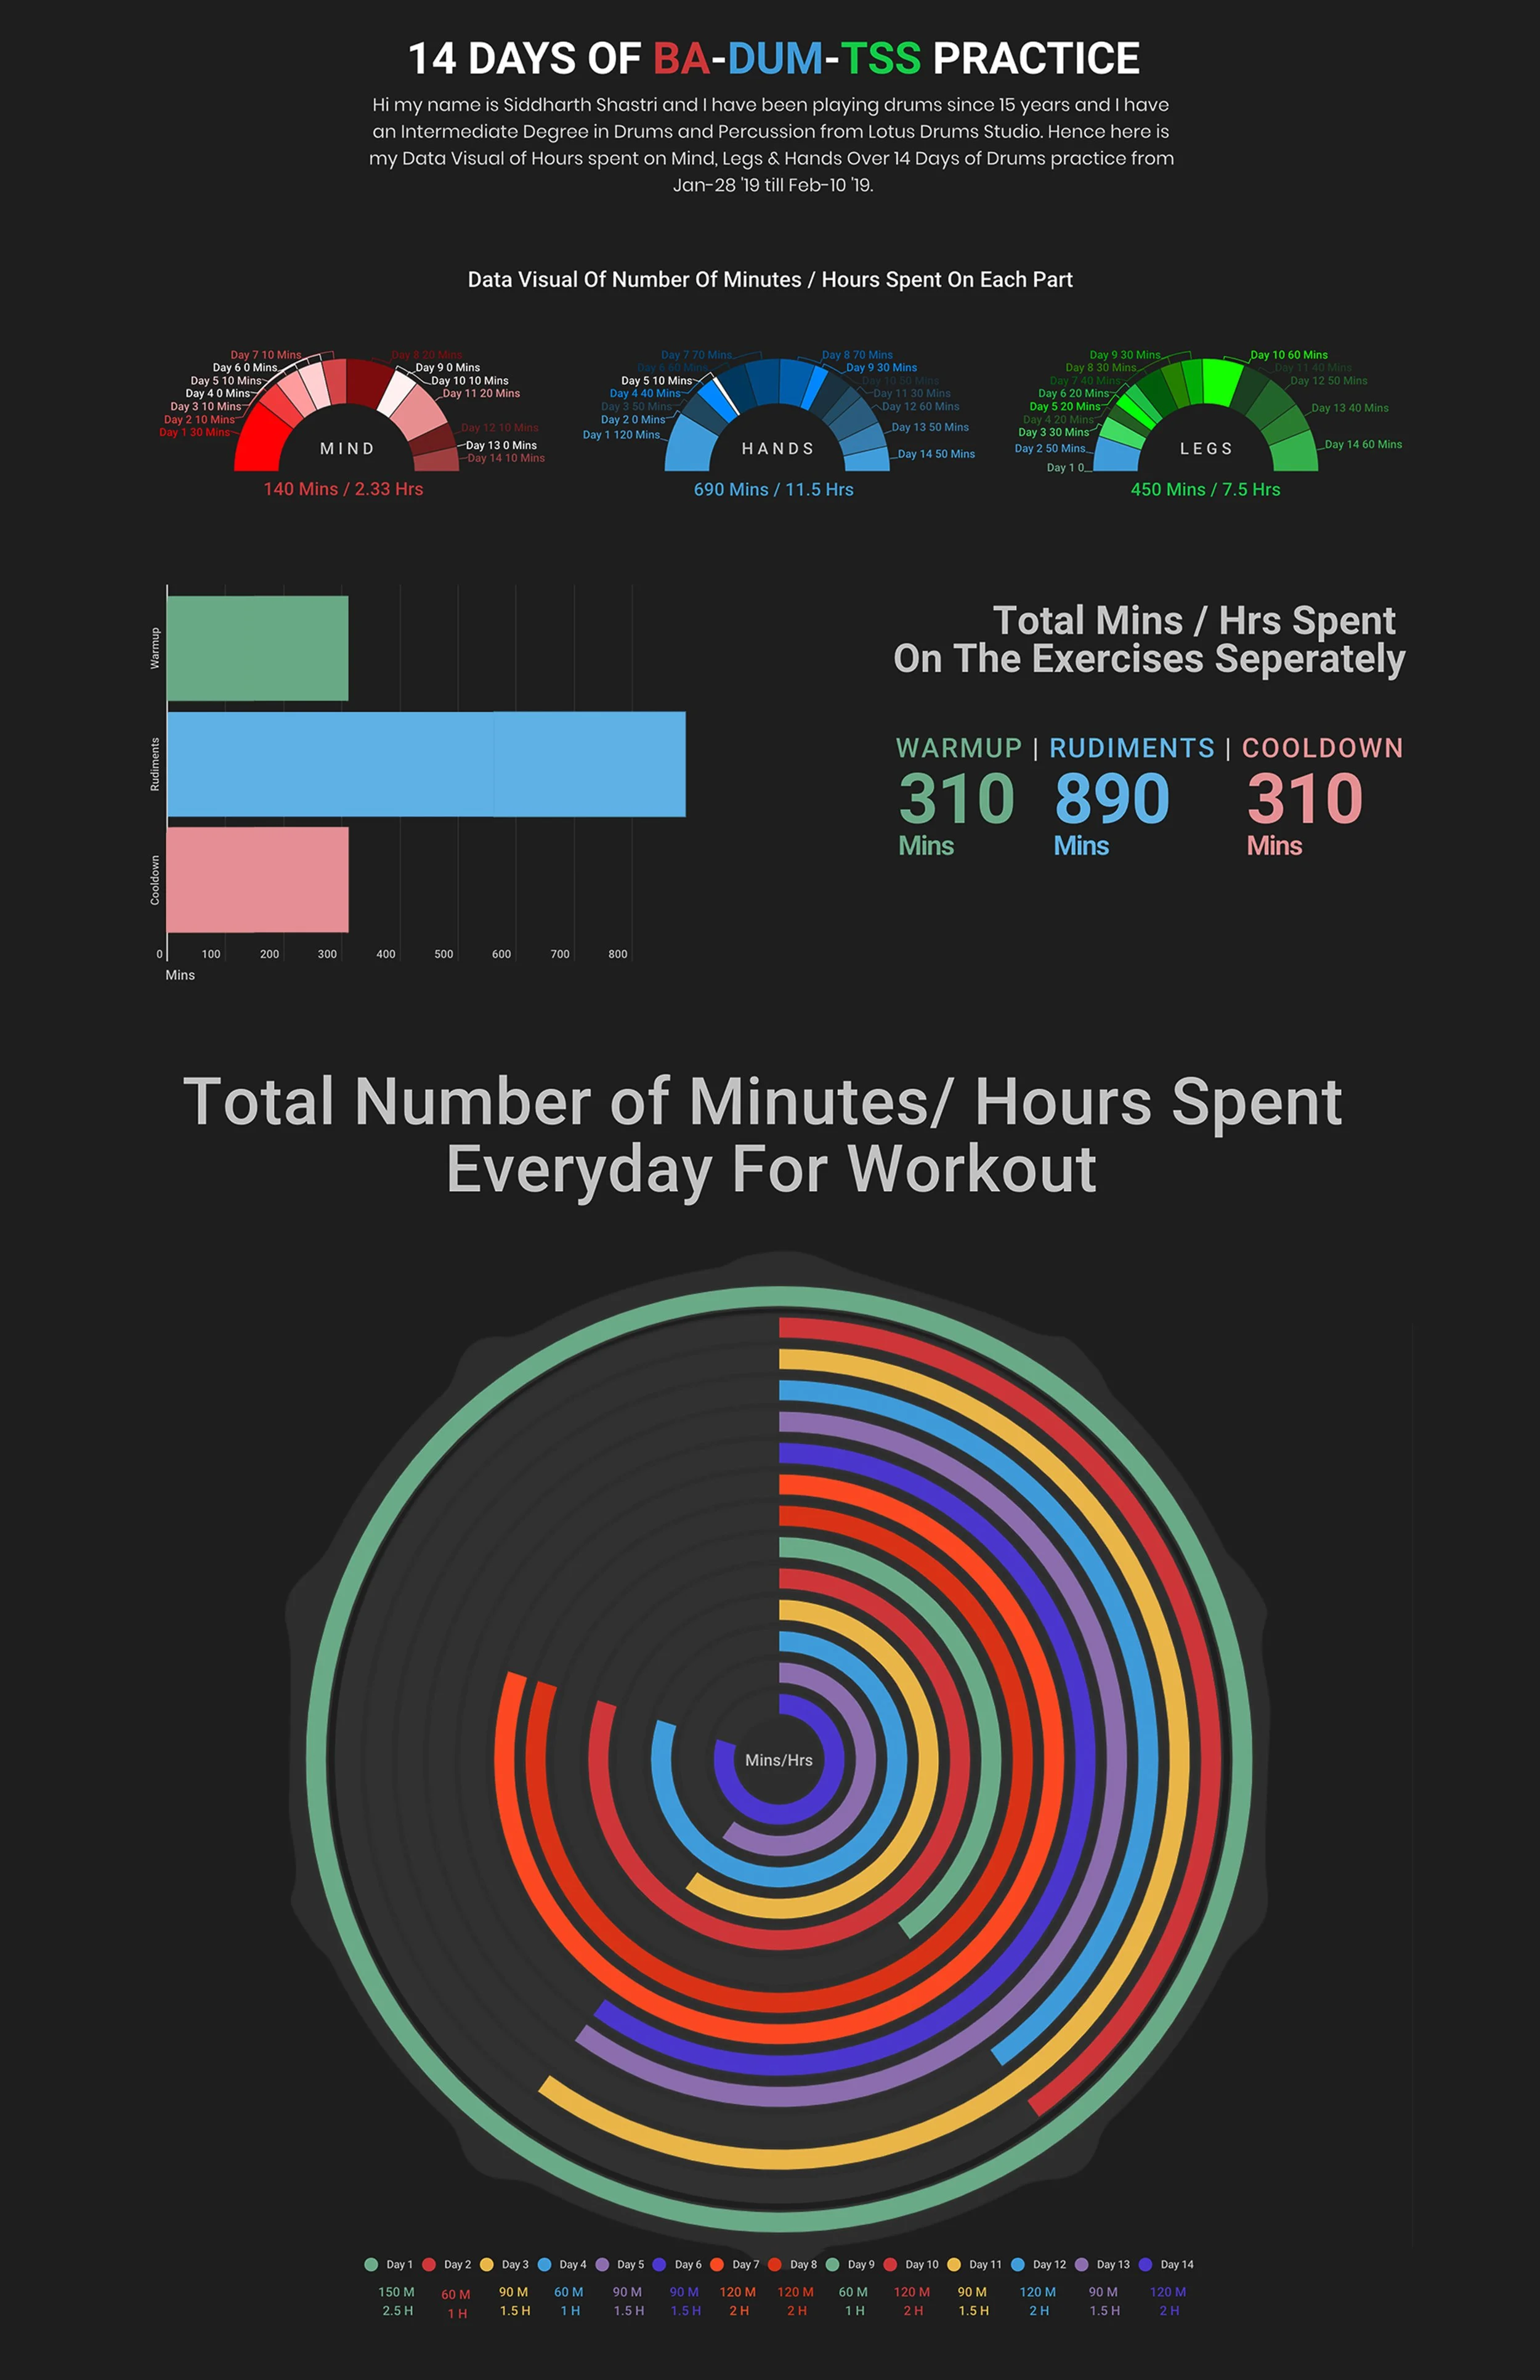
Created a detailed info-graphic of data Analyzed in 14 days of percussion / drums practice. This design was made using a pie chart, horizontal bars and a tachometer style design to explain the routine of my practice.
ILLUSTRATOR
Created a detailed info-graphic of data Analyzed in 14 days of percussion / drums practice. This design was made using a pie chart, horizontal bars and a tachometer style design to explain the routine of my practice.
ILLUSTRATOR